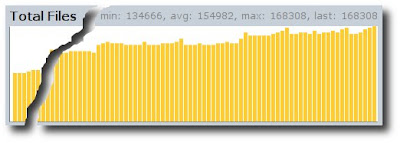
I'm having a bit of trouble figuring out how to describe this. It's a page that shows the current status and history of my backup strategy, and hopefully it's fairly obvious what's going on.
Each time the rsync process runs, the results are logged to a text file. A python routine parses the log file to determine the time the rsync was run, the number of files copied etc.
A little calendar indicates if a copy was made in each time slot of the day, this gives an interesting indication of when my computer is switched on. A histogram at the top shows the all time counts, the calendar only shows the last 30 days.
I'm using the Google Chart API to graph the number of files, total size, number of files copied and size of files copied.
The results of sbackup are determined by looking at the dated backup files and their sizes and graphed on a calendar. The size of the incremental and full backups are plotted on separate scales.
I'm also running a dump from MySQL once a day.


No comments:
Post a Comment