Friday, February 29, 2008

Ambient Email Notifier (some code)

Will asked about the code I was using in my ambient email notifier. The full code is a bit difficult to figure out because I've got it tied to a system tray icon thingi, which can go in another post another day, but here are some relevant bits.

First, you can get the number of emails with a particular label in gmail with the following Python code:

import feedparser
def msgCount(uid, pwd, filter):
    inbox = feedparser.parse("https://%s:%s@gmail.google.com/gmail/feed/atom%s" % (uid, pwd, filter))
    return len(inbox["entries"])

uid is your gmail address without the @gmail.com bit, filter is "" for the inbox, and "/label/" to get messages tagged with a particular label.

So, after calling msgCount a few times, for different labels, I compute the colour of the RGB LED:

colour = (inbox > 0 and 1 or 0) + (news > 0 and 2 or 0) + (work > 0 and 4 or 0)

This is sent over the serial port to the picaxe which decodes bit 0 for blue, 1 for green and 2 for red.

def triggerAmbient(colour):
    com = serial.Serial("COM3", 2400, timeout=0.25)
    for attempt in range(0,10):
        com.write("%c" % (colour) )
    com.close()

It tries to send a few times in case the picaxe doesn't get it the first time. The code on the picaxe just listens for a byte on the serial input and outputs the lowest 4 bits to the output pins:

main:
 serout 0, n2400, ("Ok")
 serin 3, n2400, b0
 gosub nibble3
 b0 = b0 & 7
 serout 0, n2400, (#b0)
 goto main
 
nibble3:
 if bit2 = 1 then
  high 1
 else
  low 1
 endif
 if bit1 = 1 then
  high 2
 else
  low 2
 endif
 if bit0 = 1 then
  high 4
 else
  low 4
 endif
 return 

This means the python script has control over the colour and you can test that it's working by simply opening up a terminal on COM3 and typing away (A is 01000001 in ASCII, meaning pin 1 is switched on, B is 01000010 so pin 2 is on, etc.)

Update: I've detailed the changes I made to get this working under Linux.

abcde — A Better CD Encoder

ABCDE is a nice CD ripper/encoder utility for Linux.

It's all nice and automatic, and I managed to configure it to suit my mp3 management style pretty quickly. My .abcde.conf file:

OUTPUTDIR=/home/tom/Desktop
OUTPUTTYPE=mp3
LAMEOPTS='-h -b 224'
ACTIONS=default,playlist
OUTPUTFORMAT='${ARTISTFILE}/${ARTISTFILE} - ${TRACKFILE}'
VAOUTPUTFORMAT='Various/${ARTISTFILE} - ${TRACKFILE}'
PLAYLISTFORMAT='${ARTISTFILE}/${ARTISTFILE} - ${ALBUMFILE}.m3u'
VAPLAYLISTFORMAT='Various/Various - ${ALBUMFILE}.m3u'

That sets it up to rip to mp3s at 224kbs and write out a playlist file. The files are saved onto the desktop to test before I move them to my mp3 folder in the "Artist/Artist - Track.mp3" name format that I prefer.

mungefilename () {
 echo "$@" | sed s,:,\ --\ ,g | sed s,/,\ --\ ,g | tr \* + | tr -d \"\?\[:cntrl:\]
}

I also changed the filename processing so that colons and forward slashes are converted to double dashes (my scripts use single dashes to split the artist from the track title.) And I don't convert spaces to underscores and I leave single quotes alone.

MAXPROCS=2

Runs an encoder process on each core so it goes super fast.

I run it from an icon on the desktop with the following command line:

gnome-terminal -x abcde

Update: I just discovered the "gnome-terminal -x" is unnecessary, there's an option to launch an application in a terminal window automatically...

Saturday, February 23, 2008

Backup Log Visualisation

I'm having a bit of trouble figuring out how to describe this. It's a page that shows the current status and history of my backup strategy, and hopefully it's fairly obvious what's going on.

Each time the rsync process runs, the results are logged to a text file. A python routine parses the log file to determine the time the rsync was run, the number of files copied etc.

A little calendar indicates if a copy was made in each time slot of the day, this gives an interesting indication of when my computer is switched on. A histogram at the top shows the all time counts, the calendar only shows the last 30 days.

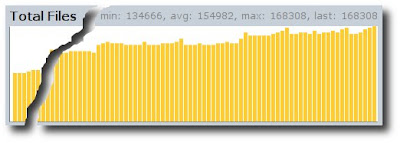
I'm using the Google Chart API to graph the number of files, total size, number of files copied and size of files copied.

The results of sbackup are determined by looking at the dated backup files and their sizes and graphed on a calendar. The size of the incremental and full backups are plotted on separate scales.

I'm also running a dump from MySQL once a day.

Sunday, February 17, 2008

Podcast and Audiobook Queue Visualisation

Some screenshots of a little web app I created to visualise my podcast and audio book listening queue:

This shows files currently on my mp3 player. The width of each file represents it's size, the "window width" being 128mb.

Files that will be copied during the next "sync" are indicated with a red dot. Files are copied according to priority, to fill the player and to have only 3 audio book chapters at any time on the player unless there is nothing else to listen to.

Audio book chapters that have been copied/listened to already are highlighted, as are those that have been downloaded but not yet queued.

The displayed title is taken from the id3 tags if possible, otherwise the filename is used. Dates and redundant "book titles" are removed from the title if possible to maximise the amount displayed, and there is a "hover panel" to display other details.

There's also a pretty calendar to provide a gauge of the age of podcasts in different categories.